
U.S. Automobile Study Infographic
Detailed infographic based the US Automobile consumer study conducted in Q1 2021. The infographic is a detailed, visual report covering a number of key data points from the full report. 3000 respondents participated in the study, over a course of a month. Over 30 data points are included in the infographic.
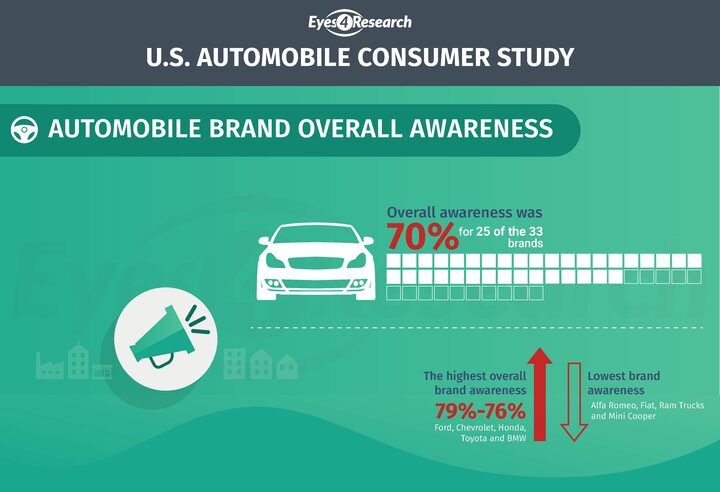
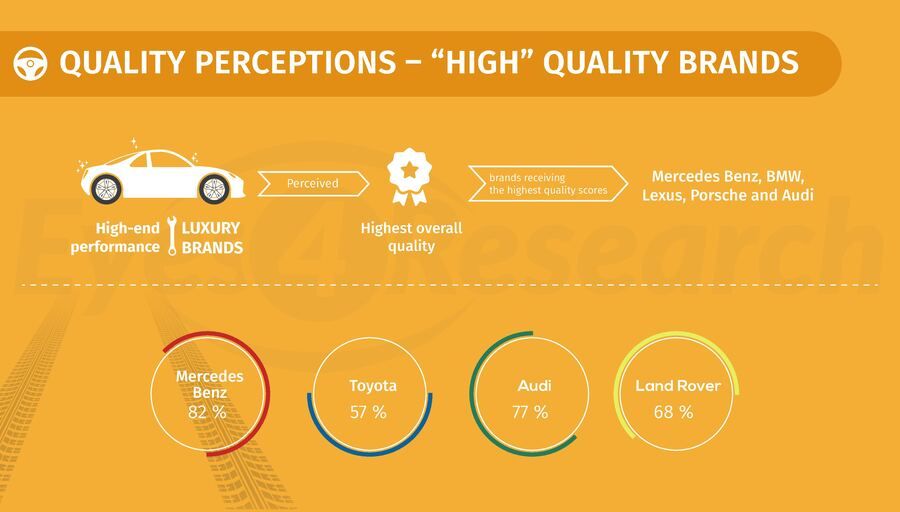
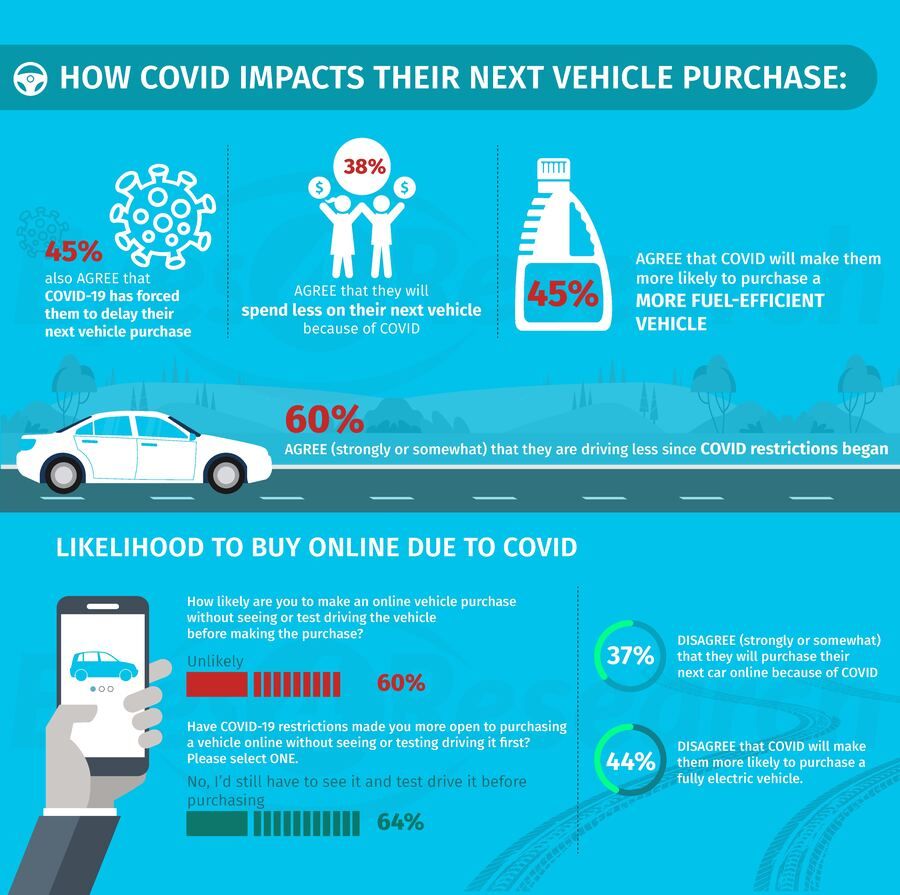
Get the full report
The full report has 5 pages. Tell us where to send it and we’ll email you the PDF, free of charge.
More reports
Holistic Pet Care Infographic
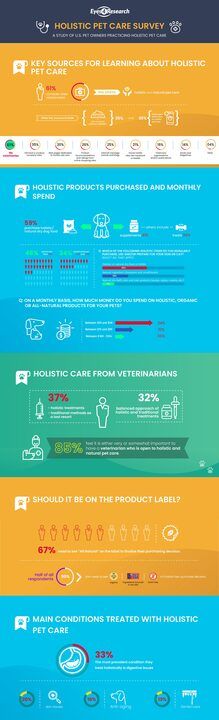
A detailed infographic based on the holistic pet care survey conducted in April. The survey was designed to understand and gain insights and usage of various holistic pet products. The infographic consists of more than 25 data points including holistic pet spending, brand awareness, shopping behavior, treatments and more….
Preview the reportHolistic Pet Care Report
This research was designed to obtain insights on holistic pet care by dog and cat owners. Insights obtained include their awareness and usage of various holistic pet products. Survey was conducted online with more than 300 small pet owners who indicated that they currently use holistic pet products.
Preview the report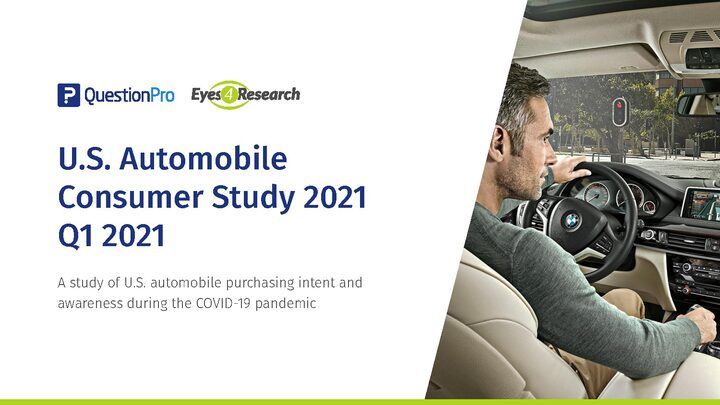
A Study on the US Auto Industry
An online survey conducted with more than 3000 respondents, who currently own and drive a vehicle, and are looking to purchase a new or used vehicle in the next 12 months. The objectives of this research are to obtain insights on consumer vehicle shopping during the COVID-19 pandemic.
Preview the report
Start your research on the right path
Tell us who you need to hear from, and we will come back with a quote.